A Whole Heaping Helping of Normal
When I'm called into a data center or large application to look at a ColdFusion performance problem I often find myself in a "war room" with highly skilled technicians and admins who may or may not know much about the JVM runtime. One of the things that require experience is knowing what normal memory patterns look like for a typical production heap. Windows admins will often go directly to the task manager or resource monitor to examine memory usage. If they are uninitiated the first thing they say is "Wow... Jrun is using a lot of memory." This often doesn't sit right to them, particularly if the site is idle. So this post is to help those windows folks (and Linux as well) to an understanding of what normal heap activity looks like.
Min and Max values and the Windows Task Manager
Let's start with those annoying settings in the jvm.config file - Xmx and -Xms. Folks tuning a production heap often set these 2 settings to the same value. For example, if they want a 9 Gig heap they set both of them to (1024 * 9) = 9216m like so:
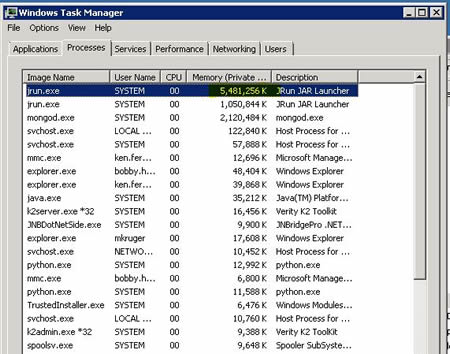
Well that doesn't seem right at all does it? Shouldn't memory show something closer to 9 Gigs? I'm only seeing 5 or so here. Ah... the "working set" is really the memory that your JVM is "addressing" - hanging on to at the moment. Fortunately you can customize your task manager to show more interesting things. To get to the amount of memory allocated you actually need to look at the "commit size". In task manager go to view-->select columns and choose "commit size" (I also add handles and threads to my customized TM view). Now we are getting somewhere.
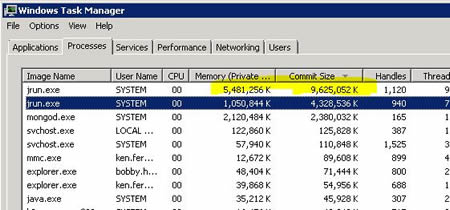
But wait a minute... this looks like over 9.5 gigs. Where did my extra memory come from? Actually the commit size is going to represent the Heap minimum (-Xms) plus the value of your PermSize (where all the core classes are stored and utilized) plus a couple hundred megs extra I've never figured out. So a given 9 Gig heap has a private working set of between 500megs and 9 gigs and a stable "commit" size of around 9.5 gigs. So far so good.
Memory Growth
Here's the Muse rule of thumb Window's folks. After taking stock of the commit size the task manager can tell you very little else about JVM memory. Windows admins can be a stubborn lot. One of the things they sometimes do is to watch that private working set and try to correlate its growth or reduction against activity on the server. This is a fool's errand.
The private set has a rough relationship to the heap with regard to growth - but little to no correlation with regard to size that I've been able to find. For example, using the ColdFusion server monitor I found that the amount of memory "in use" by this 9 Gig heap is 2.8 Gigs, yet windows shows 5.3 Gigs in the "private working set". If activity were to cause the heap usage to grow to 3 Gigs in the CF monitor you would likely see a corresponding increase (or at least change) in the private working set. But it will never match the JVM used counter except by happenstance. Indeed you will drive yourself crazy trying to match general heap growth to specific activity using the Task Manager. It is simply too crude of a tool and is once removed from the internals of the JVM. The JVM runtime plays its own game with memory most of the time. A typical memory chart on an idle server may still show memory growth. Things like the proxy scheduler, client purging, monitoring etc. - all produce some modest activity on the heap. That activity will result in heap growth until a GC runs to recover the memory. And the JVM feels no particular urgency to run a GC unless configured specifically to do so at intervals. So an idle heap might grow slowly for 10, 15, 20 minutes under zero load, then drop back to "normal". This behavior can look abnormal - like a leak - if you are not up to speed on what to look for.
Memory Leaks
To be sure you can get memory leaks in Java as well as any language. How do you know if your memory is leaking?
- Out of Memory Errors - these do not always mean a "leak". They could also mean you are resource constrained and need a larger heap or bigger hardware or whatever. Still, a leak will eventually cause an Out of Memory error - otherwise it be just an interesting memory pattern not a leak.
- Recovery never "bottoms" - when GC's run they must eventually recover memory below some previous floor. If recovery always hits above a previous floor, then eventually you are recovering smaller and smaller spaces at the top of the heap until it locks up with an Out of Memory error.
My point is that simply seeing increasing memory and scratching your head about it because not much is going on is not a memory leak. It may be a completely normal behavior of the JVM - and usually is. If someone tells you there is a memory leak your first response should be skepticism. They occur to be certain - and they can be devilish to fix. But there are dozens of things more likely than a "leak" to check before you go down that road. As a rule I don't go looking for leaks until I've proven I have one to my own satisfaction (meaning repeatable tests leaving memory that does not respond to full GC operations).
Normal JVM Heap usage on an Idle Pristine Server
Finally, here are a couple of screen shots to demonstrate a "normal" heap usage. This particular heap has been running with zero activity (other than the CF monitor) for a bit over half an hour. If left to build the chart would eventually have a quite regular "saw tooth" pattern. This "saw tooth" pattern in variation is what you are looking for in any "normal" JVM.
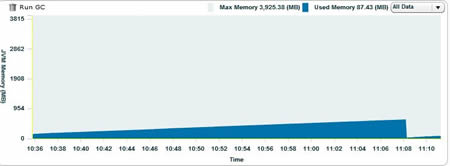
The thing to note here is that even under zero usage some memory increase building and recovery is completely normal.
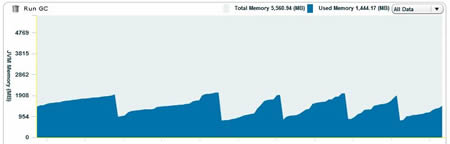
Normal JVM Heap Usage on a Busy Production Server
Finally, here is a heap on a busy production server. The gaps between the teeth are shorter but that saw-tooth pattern is definitely there. As a rule larger teeth (larger, steeper drops) are generated by "full" (tenured) GC operations while smaller drops with small amount of memory recovered are the result of "new" GC operations.
If you want to learn more about heap and memory usage my advice would be to eschew the windows tools and pick up fusion reactor or use the CF Monitor. Examine machines you know about to get an eye - a feel for what is "normal". The more you see the better you will be at spotting aberrations.
When they train the secret service agents on how to spot counterfeits (when they can pry them off of South American hookers that is) they spend little time pouring over fake money. Instead they train them to know and understand minute details of the real money. Knowing normal helps them spot counterfeit money - so they can count out eight $100 bills with confidence knowing its legal tender.... or possibly 3 tens in a pinch.
The same goes for the Java heap. Take the time to examine well running servers and get an eye for how memory is being managed on them. If you can, check out small heaps, large heaps, multi-instance etc. The more "normal" you have seen the better you will be at seeing unusual nuances.
I would add that there are dozens of other 3rd party Java tools that inspect the heap for you and can give you clues about how your memory is being used. My only caution would be to wait until you have some experience before jumping to conclusions. Some of the tools out there will flood you with information on object size new partitions and survivor ratios. I'm a big believer in getting all the information, but sometimes these things are side trails that obscure the big picture. Improving performance is often simply a matter of writing better code, making good use of your DB platform and giving your JVM enough heap and the right arguments to handle itself well.
Now I know my loving readers will happily jump in and give me their take on a post like this. As always I welcome useful comments and criticisms.
5 Comments
-
 Two very useful posts today - a simple recipe for running the MSSQL Profiler and Index Tuner, and this one. The Process Explorer (SysInternals/MS) has some more memory details but obviously can't get into the JVM memory info.
I'd love to use FusionReactor but can't afford it right now. Do you know of any other FOSS tools that would be useful in the CF environment? -
 Mark, good to see a reminder that it's always a good idea to baseline your server's memory usage before you start fighting fires.
I'd like to add a brief 'rule of thumb' to the CF devs out there reading this. There are 3 basic areas of JVM memory (new, tenured, and permanent). You can generally assume that your short-lived scoped variables (variables, this, request, url, form, etc...) will live in the 'new' space, and longer lived variables (application, server) will eventually stay in the 'perm' space. Session scoped variables might make it to the tenured space, or even the 'perm' space, depending on how long your user sessions remained active.
Now, the memory profile of your server will vary based on the applications running on them. Imagine a site with lots of user traffic, but very few of these users log in and create a session scope. This site would see a sawtooth pattern with short intervals between the peaks, and most of that memory would be in the 'new' space. Compare that to a smaller site, where everyone logs in and a large session structure is maintained for all users (say, an intranet). This server would have longer periods between peaks, and most of the JVM heap space would be in the tenured or perm area.
Just having an understanding of the relationship between your site's traffic pattern and your code's use of scopes can help you tweak your memory settings to just the right setting. -
 @Roger,
There are a few projects out there that are open source monitoring and most of them include allocated/free params. I'll see if I can post some links later.
-Mark
Sites to Watch
Aggregators


RSS
