DB Indexing Matters: Using the "Database Engine Tuning Advisor - MSSQL 2008
Here's a Muse mantra you can hang your hat on (and your overalls and duck suite as well). Application performance starts at the database. Sure JVM tuning is important. So is networking, processor power, memory, file i/o and keeping cousin Eustace from pressing the red button on the front of the server. It's all important and it all has a place. But as someone who does an interminable amount of application tuning I can tell you that after setting an appropriate heap size 8 out of 10 performance issues are DB related. And 8 out of 10 DB performance problems are related to indexing. So the first thing a Muse troubleshooter does is check for appropriate indexing.
This is often a matter of pouring over the longest page requests or queries and making educated attempts at new indexes (or removing and changing old ones). But more often than not it's simply a matter of informing the client there is no indexing and some will need to be added. This begs the question, why don't developers think about indexing when they create table schemas? Surely they can't all have come from enormous shops with in-house DBA's (who are just as likely to forget indexing in my experience). In this post I'm going to share a helpful tip for those of you lucky enough to be using MS SQL Server. The specifics below are for MSSQL server 2005 or 2008, but there is a version of this tool in the MSSQL 2000 profiler as well.
Easy Does It
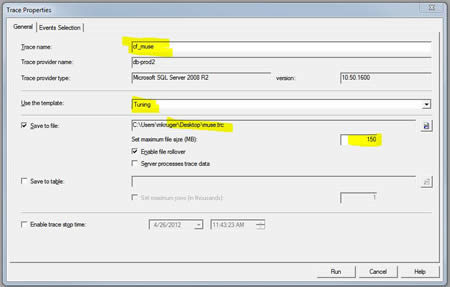
If you are using Microsoft's SQL server you have an advantage when it comes to figuring out indexing. You can make use the "Database Engine Tuning Advisor". This handy little tool will create a list of "recommendations" that will get you 80 to 90 percent of the way to an indexing scheme that works well. The remaining 10 to 20 percent takes experience and intuition and we'll save that for another post. To use the index tuning wizard you first need to create a trace file. Inside of MSSQL Management Studio go to the "Tools" menu and open up the "Profiler". It will ask you to log in to your server, then it will present you with "trace Properties". On the first screen enter a name for your new trace file and choose the "tuning" profile. Check the "save to file" check box, choose a location and set the max size to something high enough for the traffic you expect. Note: high traffic sites will generate a lot of data - a 30 or 40 meg file in a few minutes.
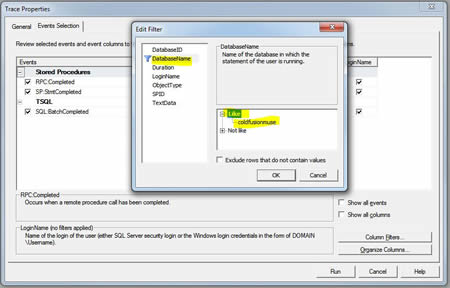
Click on the "Event Selection" tab at the top. This is where we are going to add a filter for our Database. Without a filter the trace will capture all the activity on the server. That's not a good idea for a really busy server and it will be difficult to analyze. We want to capture just the activity for the DB in question. So click on "Column Filters" at the lower left and select "database name", then choose "Like" and enter the name of the DB (the name from SQL Manager).
Now that we have our trace set up we are ready to capture some information. When I run a trace I often open explorer and navigate to the trace file location so I can keep an eye on the file size. I usually stop when I have less than 100 megs (25-30 is often sufficient). Ok, Muse readers... if you a ready, click "run" and you should see something like this.
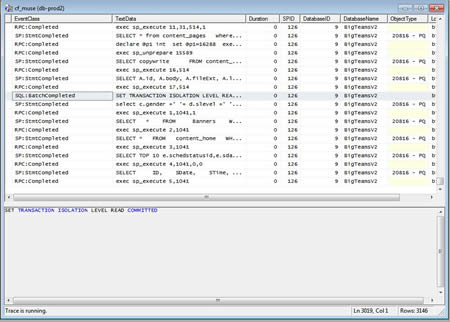
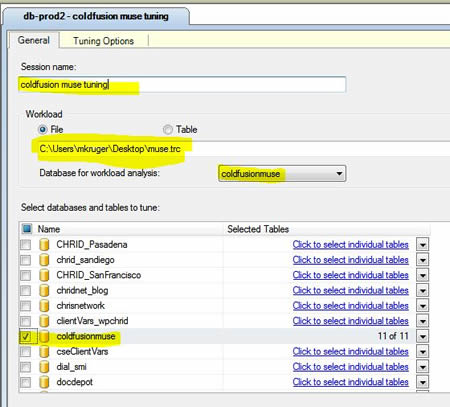
Clicking around will allow you to see various queries that are being run. It's actually very useful as a way of understanding the sort of thing that your application is doing under the hood. It might surprise you to see some queries run constantly - giving you a place for further analysis. In any case, when your file is large enough click on the red square "stop" button at the top. We now have a "working file" - think of it as playback of queries that can be analyzed. The next step is to actually do the analysis. Inside of profile click on tools-->database engine tuning advisor (you will be asked to login again). In the property screen that appears create a name for your session, navigate to your file and select the DB from the dropdown list, then select the DB checkbox again in the lower tabular list. You can also select individual tables to tune as well (if you wish). There are several tuning options you can adjust but the default is actualy a good starting point.
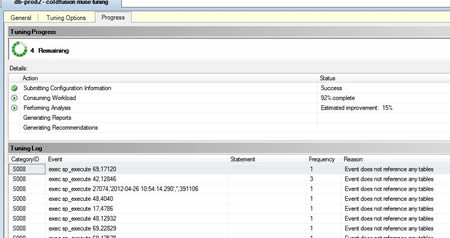
Click on the "start analysis" button (it's kind of misplaced but it's on the menu bar). You will see the process spinning and some progress indicators. The application first reads in the workload file, then does it's analysis and finally produces reports and recommendations. Note that the speed of this process might vary and it greatly depends on how busy the DB is (and the size of the file). Be patient. The one good thing about this tuning advisor is that it does not seem to drag the DB down to run it.
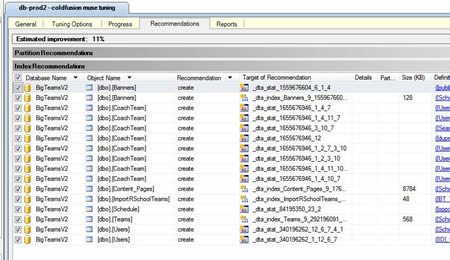
Once complete you will get some recommendations. The summary will tell you the "expected" improvement. The recommendations (if you use the default params) come in 2 varieties - indexes and "statistics". Statistics are sort of DB metadata that allows the execution planning engine to make better decisions. For example, if the engine wanted to know whether it was faster to use a table scan or an index to get to a particular row in a table it might make sense if it knew the approximate number of rows in the table - then it could make an "informed" decision. But you don't want the planner to have to "look up" the number of rows - that would sort of add a step and defeat the purpose. So instead the engine provides stats that it updates periodically to give the engine tips on how to best optimize its operations. DB stats get created and periodically updated automatically (using the default settings) but additional stats regarding columns in a table are also possible and highly useful. The tuning engine comes up with that sort of thing for you.
Once your analysis is complete and you have your recommendations go to the Actions menu and choose "save recommendations". It will produce an SQL script that you can take, modify, run, save for posterity or whatever. After saving the file you can choose to "apply" the recommendations (also in the Actions menu). Doing so creates the indexes and stats for you - but be warned that when you "apply recommendations" save them to a file any more. That's why it's advisable to save the recommendations script and then apply them.
How effective are the recommendations? If SQL is telling you that it can gain you a 25 percent or more improvement then you can bet they will be effective. If the percentage is lower and there are few indexes and mostly stats indicated then they will be less effective (obviously). In most cases you are pretty safe taking all or most of the recommendations offered. But if you are nervous take the script and "prep" some drop commands so you can remove the indexes if they have an adverse or unintended consequence. Good luck Muse readers and happy indexing.
3 Comments
-
 Great Entry Mark... You know I could of used this yesterday though :)
 -
 @Jason,
Yeah.. well now I can just say "I have a blog post on that - I'll send you a link" :D
Sites to Watch
Aggregators


RSS
