Site Testing With Jmeter
Recently I did a user group presentation on testing an application using Jmeter. Notice that I did not say "load" or "stress" or "performance" testing. There are many different types of testing you can do to your application. All applications can benefit from testing for performance or load - although there is a cost factor involved that can prevent some folks from taking the time to test smaller apps or apps with an expected predictable or lite load (like an internal application for example). Still, it is something that every developer should consider. Generally speaking there are 3 increasing levels of testing that rise "up the scale" in complexity and cost.
- Performance Testing - To do a performance test you usually you put a reasonable or expected load on an application and examine the internals. By internals I mean memory usage, processor usage, database performance and specific pages that you suspect need tuning. There might be many other things you want to look at here - networking, third party services etc. The goal is to find bottlenecks and improve performance under the expected load. Almost everyone does some form of performance testing - even if it's just loading up a page and looking at the debug info to see what sort of time it takes to run a query or execute a routine. When finished you have a "tuned baseline" - a set of expected benchmarks you can reasonably expect your application to meet (until the database crashes or some data center guy trips over the power cord anyway).
- Load Testing - Load testing is sort of generically thrown around to mean both performance and stress testing. In reality a true "load test" (at least by the book) means maximum load for a sustained period. In other words, pushing your application to the top of the curve and leaving it there for anywhere from an hour to a couple days to see if it degrades over time. So really it is more like "marathon" testing or "endurance" testing. Load testing teases out things you might not expect - bugs that occur over time in large data sets, crashes that have a threshold or duration attached to them, memory leaks, and timed problems that occur when events conflict (like backups or scans). Most folks do not do any load testing. Load testing is very expensive and time consuming and simply understanding the data set will require experience and patience. If you have invested in a high level application where perforamance and capacity are important long term factors then you should probably be load testing.
- Stress Testing - The goal of a stress test is to see where your application will finally break, and how it recovers after crashing. In other words you add an increasing amount of requests to your app until it stops functioning, then you see if it recovers. Does it require a hard kill? Is any permanent damage done? Are there corrupt files? Orphaned DB records? Finding out where your system crashes gives you a baseline for capacity planning and allows you to fix issues related to potential crashes.
Jmeter - What is it?
Jmeter is a java application that you can find at jakarta.apache.com/jmeter. It's actually a full featured testing platform that can be used to test all kinds of protocol based services and applications (SOAP, JMS, Databases etc.). In distributed mode you can put an amazing amount of pressure on a web application. 2 or 3 desktop machines are sufficient to flood a web server with hundreds and thousands of concurrent requests - bringing most of them to a full stop.
Installation
I won't cover the full install here but remember that it's a Java application. If you have a a java SDK set up and a JAVA_HOME environmental variable (and Java.exe is in your path) you are probably ready to go. Simply download the zip file and extract it to a folder. Once extracted there are 2 .bat files in the "bin" directory that we will use, jmeter.bat and jmeter-server.bat. We will talk about jmeter-server.bat in a follow up post. For now, click on jmeter.bat and you should get the Jmeter gui (a typical Java swing gui - a bit clunky but serviceable).
Your First Test
You are going to see 2 items initially - a "test plan" and a "workbench". We are going to focus on the test plan. You can rename it anything you like. Simply click on it to highlight it, then change the "name" value in the right hand form. Go ahead and save it to - just so you won't forget. Working with Jmeter is a little odd because it has its own lexicon. Users are actually groups of threads - so your first task is to add "thread groups" to your initial test plan. These groups of threads are going to fire in a calculated fashion and make requests against your web server. You will have control over how often they fire and how many concurrent threads you wish to support. Right click on your "test plan" and select Add->threads->thread group. Click on the group and rename it "group 1" using the "name" in the right hand panel (note, once renamed you have to click "off" the group and back on for the new name to appear in the outline - weird I know).
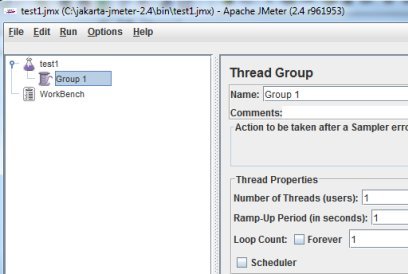
Notice the 3 settings you have to work with - number of threads, ramp up period and loop count. Basically these three things dictate how aggressive this thread group will be. The number of threads is analogous to the number of users. Ramp up is how quickly all of them are introduced (0 means all at once, 5 means every 5 seconds etc.) and the loop count means how many times this group of threads will run through your list of requests. Easy right? Let's set each of these values to 5.
Quick Tip on Thread Groups
When I first started I would add as many groups of users as I wanted to use - roughly analogous to the amount of pressure I wanted to put on the server. I would add 5 or 6 thread groups and then go through and configure them individually. Later I realized that all of them were going to be quite similar. Since Jmeter cut and paste operations work really well, I created one thread group and fine-tuned it, then pasted it over and over till I had as many as I wished. Then I configured each of them individually to scale however I needed them to.
Adding a Default
Jmeter has nice "config elements" that allow you to define certain things. One of them is called "HTTP Request Defaults". It allows us to predefine our site, port, timeout, encoding and default params to send with each request. Most of the time you will want to simply define the site. To add this config element right click on your thread group and choose Add->Config Element->HTTP Request Defaults.
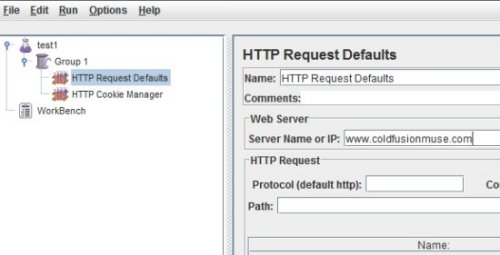
I suggest you do this so that you do not have to add these settings to your individual HTTP requests (coming soon - hang in there). I'm going to add "www.coldfusionmuse.com" to mine.
HTTP Cookie Manager
One of the serious flaws in some of the testing I have seen has to do with sessions. If you fire thousands of requests at your application you may be creating thousands of sessions - a new one with each request. This is because unless you specifically configure it a load tester tool is not going to retain a session cookie and pass it back with the next request. The web server simply sees a new request and consequently creates a new session. This may be what you want (and you may indeed want to test how many sessions you can tolerate), but more than likely your script will need to be "session aware". For example you may want to test a login protected area of the site - in which case you will need to simulate the login and retain the session so that subsequent requests to protected content succeed.
Rather than force you to do something tedious like collect jsessionIDs, Jmeter has a "cookie manager". To use it you simple right click on your thread group and choose Add->config element->HTTP Cookie Manager. Jmeter will then track cookies for each "thread" (user) and each user will have its own session. There's one setting - "clear cookies after each iteration" - that allows Jmeter to get a new session for each entry to the top of your loop. You may or may not wish to use that. Using the cookie manager is probably what most folks will need to do to get an appropriate test.
Adding HTTP Requests
Finally we are ready to add some actual requests to our test plan. Your requests will be executed in order and multiplied times the number of users and iterations. We are going to add 5 separate HTTP requests to our test plan. We have 5 users and 5 loops so the total number of requests aught to be 5x5x5 or 125 requests for our thread group. You can see how the load could increase exponentially by adding more users and loops and/or reducing the ramp-up time - and especially (as we will see) by adding additional thread groups.
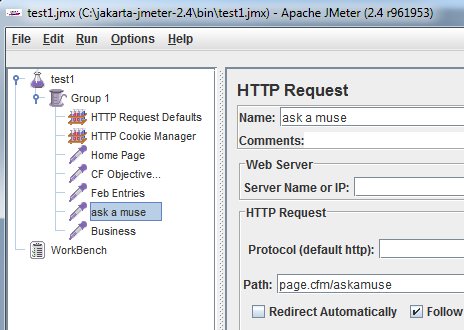
Request events in the Jmeter lexicon are called "Samplers". We are going to add one for the ColdFusion Muse home page (index.cfm), CF Objective resource list (/index.cfm/2011/5/19/cfobjective.presentations), February entries (index.cfm/2011/2), our askamuse page (page.cfm/askamuse) and our business of development category (index.cfm/business-of-development). So our first task will be to add 5 new "HTTP Samples" to our thread group - naming each of them appropriately. Right click on "group 1" and select Add->Sampler->HTTP Request. Then for each one put in just the path (no need for server name or ip - remember our default config element?). Actually you can simply "copy" the first one and paste it 4 more times... easy!
Maybe you have pages with URL or Form paramaters. Each request can be configured with various name value pairs and/or as a POST or GET request. The requests are generated in order by th thread as well, so if you added a "login" post request at the beginning followed by a "my account" and a "report" (or whatever) each request would have the session/login information it needed to be successful.
Collecting Results
We can stop right there and run our test if we want - in fact it might be a good idea just to make sure all of your data is entered correctly. The problem is that we haven't set up to collect any data or monitor our test. Now you don't need Jmeter to monitor your test necessarily. Boot up Fusion Reactor or Perfmon or the ColdFusion Monitor or whatever your favorite monitoring tool happens to be and examine the responsiveness of your server during the test. In some cases that is exactly what I do - I'm looking to recreate a specific condition or error or whatever. Still, Jmeter has some real time monitoring and collection built in that is useful as well. To get that working you need to add a collector to your thread group and some sort of viewer to your test plan. Each thread group (as I understand it) needs a collector. In the Jmeter lexicon these are "listeners".
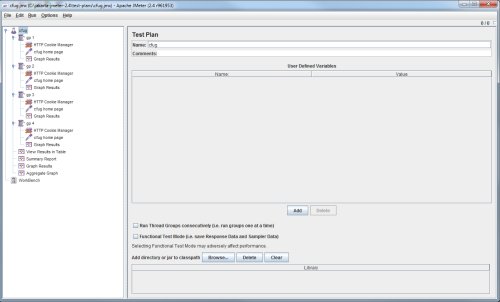
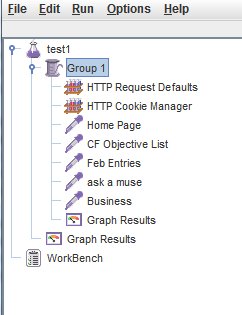
There are many listeners and you can experiment till your hearts content - but for this psot we are going to use a visual lisetner called "graph results". Right click on your thread group and select Add->Listener->Graph Results. Then right click on your "Test plan" and do the same (add-listener-graph results). When you finally run your plan you will see some actual data appear as a scatter chart in this lower area. Here's what our test plan looks like to date:
New Thread Groups
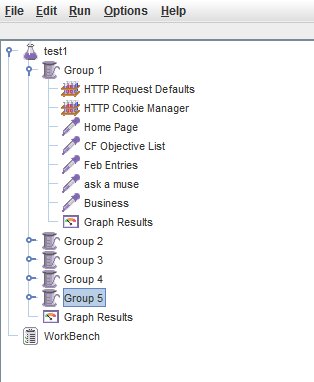
Finally let's go crazy and duplicate our work by copying our thread group and pasting it back into the test plan 4 times (renaming each group respectively) for a total of 5 thread groups. Now our final test plan looks like this:
Ready to Roll
Before we run our test let's recap how many requests we think we are generating. We have 5 groups times 5 users times 5 iterations times 5 requests - 5 x 5 x 5 x 5, right? So with our little test we are generating a total of 625 requests with a high concurrency (because we didn't set anything up for ramp up time). To run, click on the "graph results" for the test plan so you see the graph panel, then hit control+r or start->run. You should see something like this:
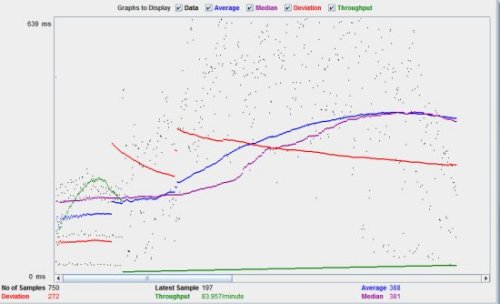
Looking at this chart the item that I care about is average - the dark blue line. As the load increases it rises but then levels out nicely. I'll leave it to you to interpret the other plots on the graph. Meanwhile there is more to do with Jmeter. In my next post I'll discuss adding additional Jmeter servers together in a distributed configuration for a massive stress test. I'm also keenly aware that others in my reading audience will have additional tips and input on this topic. I'm an experienced troubleshooter and tester, but I know I'm not getting the most out of this tool. I look forward to your tips and tricks for getting Jmeter to maximize it's potential. One more thing, if you try my example please do it with your own web site and not coldfusionmuse.com. Thanks for the consideration.
7 Comments
-
 Your test results would be more impressive with extended graphs from here: http://code.google.com/p/jmeter-plugins/
 -
 +100 for extended graphs. They work really well.
Another thing to look at is BadBoy (http://www.badboy.com.au/) This app basically captures your browser behavior. or as the website says "Badboy is an application which makes testing and building Web applications easier by combining a capture/replay style testing tool with live diagnostics on the activities your browser is performing while you navigate your site."
That said one feature that has really made my testing efforts much easier is that it will export your results in xml format that jMeter can read as test cases. I found it much easier to simply run through the site using badboy, export it as a jmeter test case. Then weak the file a bit, and finally run the test cases in jMeter. -
 @larry,
Hey! I've been looking for exactly that plugin! The one proxy macro recorder I tried (I think it was from jakarta) was really hard to configure. Thanks! -
Glad to help. You can buy me a beer some time.
Anyhow it saved my behind more than once. One of these days I'm going to have to do a preso on this little app. -
 This is awesome, I'm giving it a try today!
BTW, the url you have for the download is wrong, it should be http://jakarta.apache.org/jmeter (.org instead of .com). :) -
 Talking about JMeter, we should mention
<a href="http://blazemeter.com/blog/5-poisonous-sins-lead-p... reasons of bad performance</a>.
And, perhaps, it is not needed to examine every script that is executed on your werb-server, but to fix mentioned problems.
Sites to Watch
Aggregators


RSS

Related Blog Entries